Retail Performance Dashboard: The 10 KPIs Every Store Manager Should Track
Frontline-First: The Biggest Retail Workforce Trends to Watch in 2026
December 4, 2025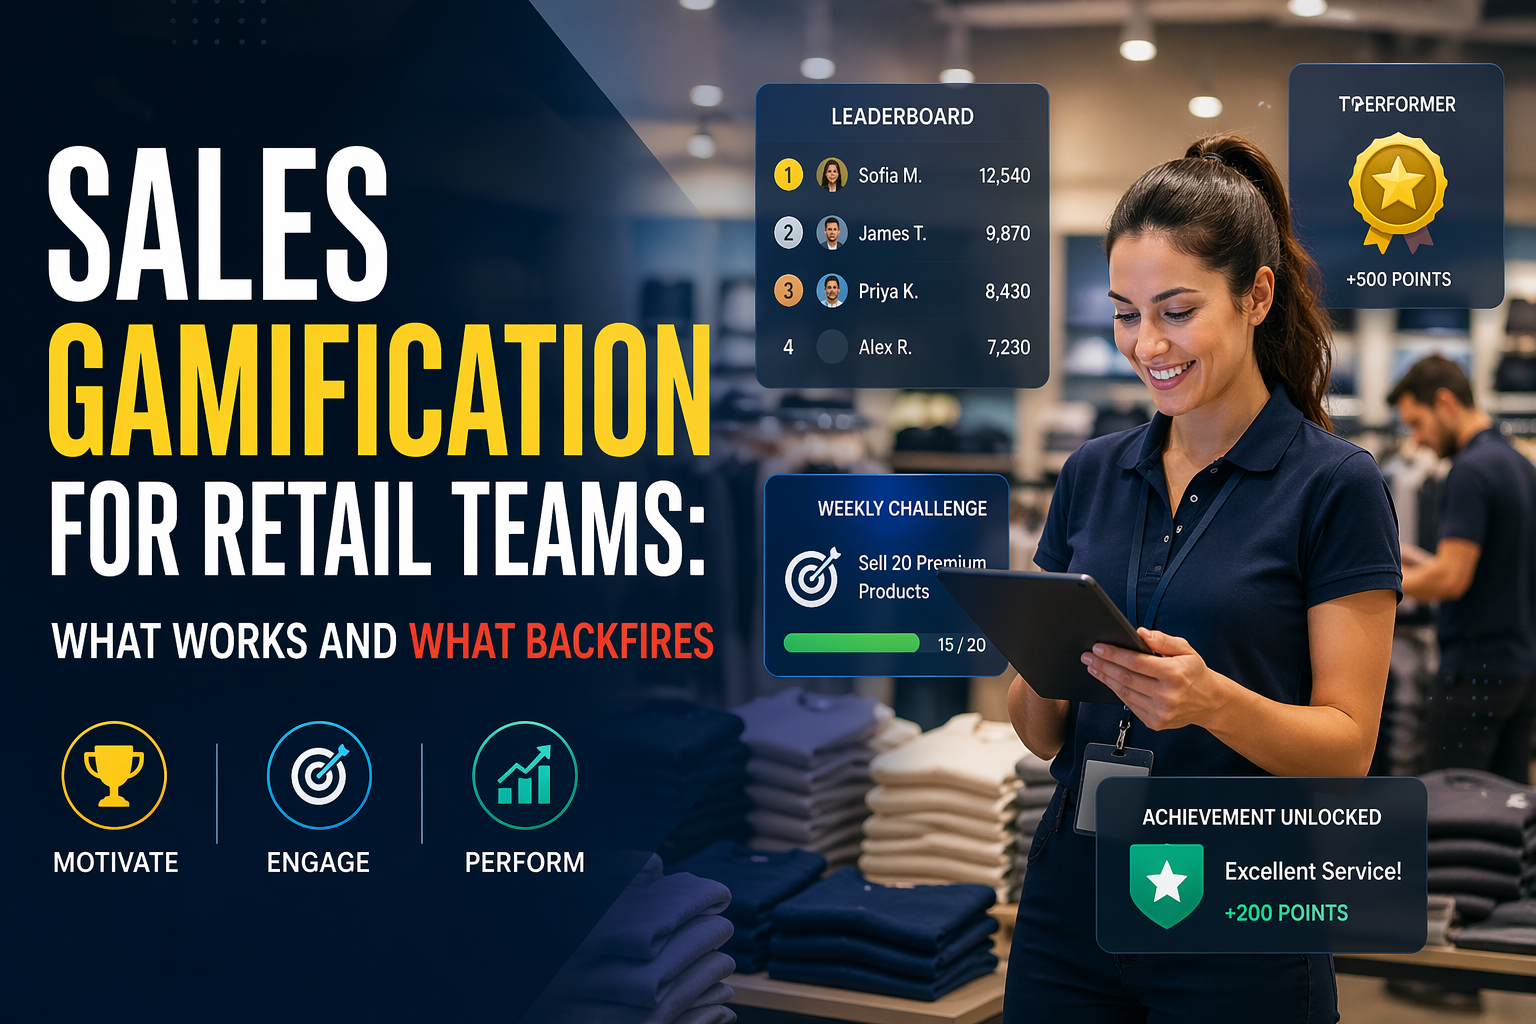
Sales Gamification for Retail Teams: What Works and What Backfires
April 24, 2026
Retailers rarely suffer from a shortage of data. They suffer from a shortage of useful focus.
Most stores already track sales, conversion, basket size, labour, stock, compliance, and customer feedback. The problem is not whether the numbers exist. The problem is whether managers can see the right retail KPIs quickly enough to act on them.
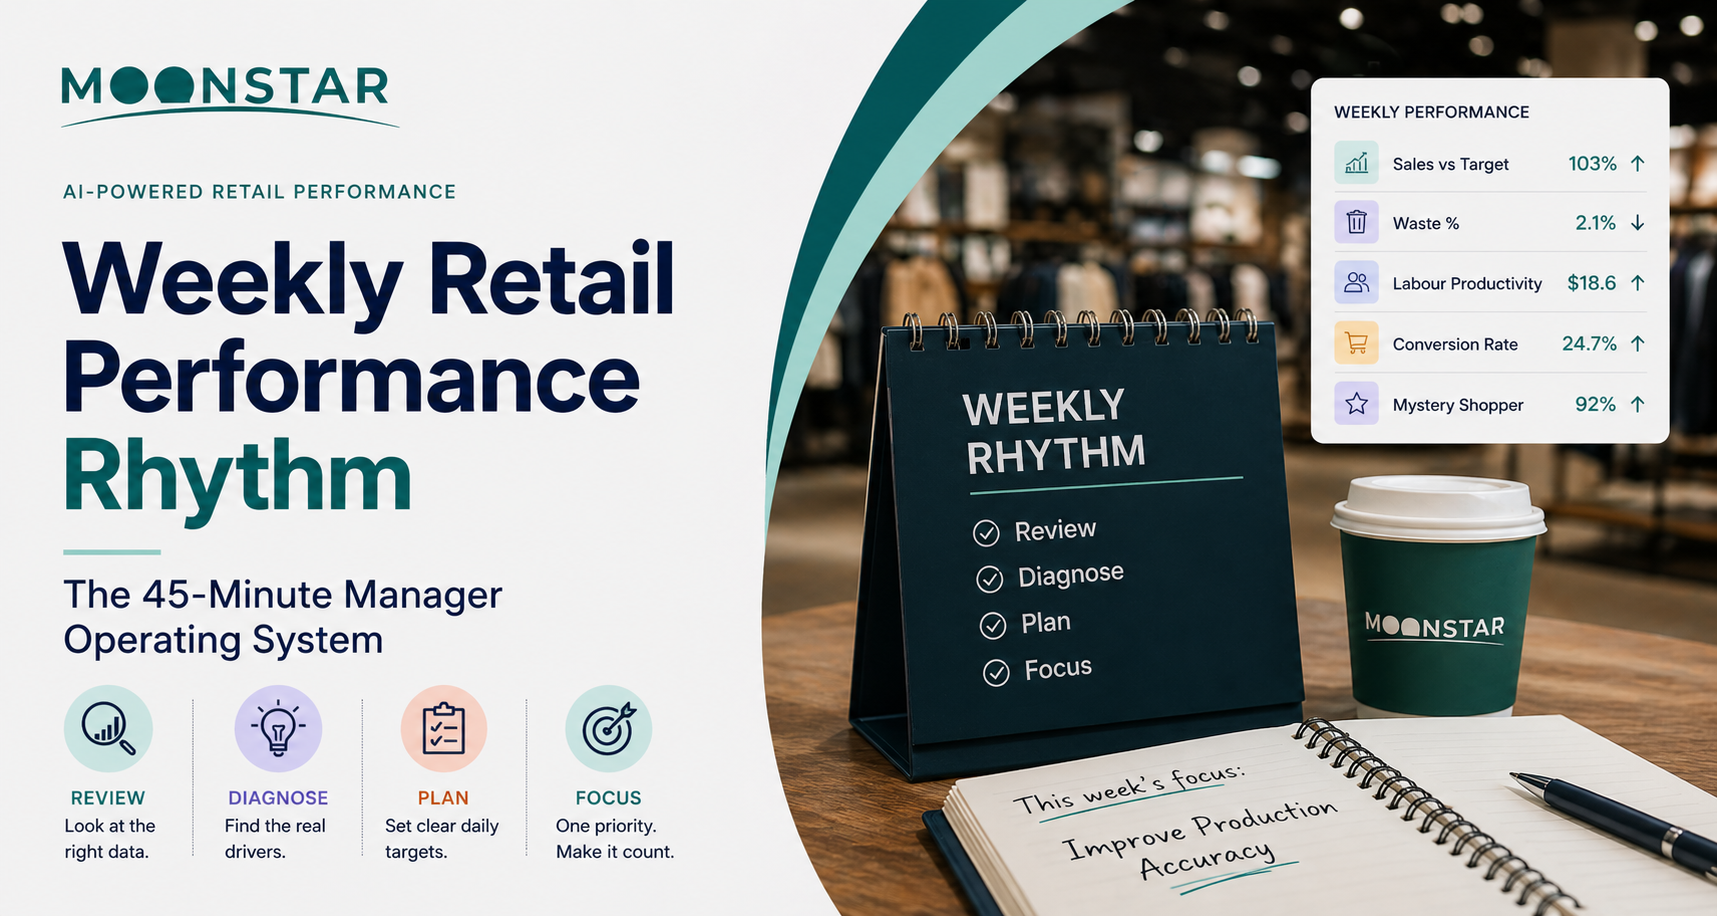
That is where many dashboards fail. They become a long list of metrics with no clear targets, no ownership, and no signal about what managers should do next. A good retail performance dashboard does the opposite. It makes store performance visibility part of the weekly manager rhythm, highlights performance gaps, and points managers toward actions they can take this week.
For retail operations leaders, area managers, and store managers, that is the real job of a dashboard. Not to document the past in ever more detail, but to help teams improve execution.
Why a retail performance dashboard matters
A store does not improve because someone can see more data. It improves because managers can connect performance to behaviour.
That is why the most effective retail performance metrics are not just outcome measures. They show where teams are off target, where execution is breaking down, and where action this week is most likely to lift results.
In practical terms, a strong retail dashboard for store managers should help answer five questions:
- Are we on target?
- Where are the biggest performance gaps?
- Which stores, teams, or shifts need attention?
- What is driving the result?
- What can a manager do this week to improve it?
That sounds simple. Yet many retail KPI dashboards still over-index on lagging outcomes and underplay the daily behaviours that shape them.
The 10 KPIs every store manager should track
The most useful retail KPIs are the ones managers can understand, explain to teams, and influence through better execution. They should be simple enough that teams actually care about them and specific enough that managers know what to do next.
Here are the 10 KPIs every store manager should track.
1. Sales vs target
This is still the starting point. Every store needs clear targets, and every manager needs to know whether the store is ahead, behind, or recovering.
But sales versus target should never sit alone. When a store is off target, the retail performance dashboard should immediately show the likely drivers rather than forcing managers to hunt across different systems.
Manager action this week:
Review underperforming days or dayparts, identify whether the issue is traffic, conversion, ATV, or stock availability, and set one focus action per shift.
2. Conversion rate
Conversion is one of the most important store performance metrics because it shows how well a store turns traffic into buyers. A high-traffic store with weak conversion usually has an execution problem somewhere: selling behaviour, service speed, queue management, merchandising clarity, or availability.
Manager action this week:
Observe the shop floor during peak periods. Check greeting standards, queue times, fitting room support, and whether key products are available and easy to find.
3. Average transaction value (ATV)
ATV is a core retail sales KPI because it shows whether teams are building value into each transaction. A weak ATV often points to missed cross-sell, poor bundling, or low confidence in recommending add-ons.
A good retail performance dashboard should not stop at ATV. It should make the recommendation behaviours behind ATV visible. In one department store, managers discovered that their top shoe seller consistently lifted results by showing more options, making tailored recommendations, and confidently introducing add-ons. When those behaviours became simple lead measures for the wider team, performance improved quickly — a strong example of why recommendation quality matters more than just telling teams to sell harder.
Manager action this week:
Set one basket-building focus for the week, such as a bundled recommendation or premium trade-up, and review progress in the weekly manager rhythm.
4. Units per transaction (UPT)
UPT is one of the simplest retail KPI examples because teams understand it quickly. It gives a clean view of basket-building behaviour and is often easier for store teams to influence than topline sales alone.
Manager action this week:
Set a clear linked-selling target, recognise the best examples in huddles, and use leaderboards carefully to create fair competition across comparable stores or shifts.
5. Attachment rate
Where relevant, attachment rate is one of the clearest retail sales dashboard metrics because it shows whether teams are consistently recommending complementary items, upgrades, or services.
This matters especially in categories where margin depends on what gets attached to the main purchase.
Manager action this week:
Pick one priority attachment behaviour, coach it on the floor, and measure recommendation consistency before expecting the commercial result to move.
6. Sales per labour hour
Store managers are not only responsible for sales. They also manage productivity. Sales per labour hour is one of the most practical retail store performance metrics because it links staffing decisions to output.
Low productivity can point to weak scheduling, poor deployment, capability gaps, or leadership inconsistency.
Manager action this week:
Review peak trading periods against staffing patterns and adjust rota decisions where service or selling coverage is weakest.
7. Stock availability on priority lines
If priority products are unavailable, conversion and ATV will suffer no matter how strong the sales team is. That is why availability belongs in any retail performance dashboard.
Manager action this week:
Check availability on top sellers and promoted lines daily, escalate recurring gaps quickly, and avoid judging stores unfairly where stock constraints are clearly affecting performance.
8. Promotional execution
Promotions do not fail only because the offer is weak. They also fail because the execution is inconsistent. Missing POS, poor display setup, or store teams that cannot explain the offer properly can all drag down results.
Manager action this week:
Audit promotional readiness at store open, confirm team understanding, and compare promoted-line performance across stores to spot execution gaps.
9. Customer feedback trend
Customer feedback is often treated as a brand-level measure, but it is also a useful store performance metric when handled properly. The key is to track trends and themes, not just static averages.
If customers mention long waits, poor service, or weak product knowledge, managers have something specific to address.
Manager action this week:
Review recurring comments with the team and turn them into one clear behavioural priority for the next shift.
10. Coaching completion and follow-through
Many dashboards stop at outcomes. Better retail KPI dashboards also track whether managers are coaching the behaviours that drive those outcomes.
Coaching frequency alone is not enough. What matters is whether coaching is tied to a clear target, followed up, and linked to measurable improvement.
Manager action this week:
Identify one underperforming KPI, coach one behaviour linked to it, and review progress within seven days.
Lead KPIs vs lag KPIs
This is the distinction that makes a retail performance dashboard useful.
Lag KPIs are the scoreboard. They tell you what happened. Sales, conversion, ATV, UPT, and attachment rate all sit here.
Lead KPIs are the steering wheel. They show the behaviours and conditions that shape tomorrow’s result. Recommendation behaviour, promotional readiness, coaching follow-up, queue checks, and training completion are all examples.
Too many retailers try to manage the lag KPI directly. They tell stores to improve sales or lift conversion without showing what needs to change on the shop floor.
Better operators work the other way around. They use retail performance metrics to identify performance gaps, then focus managers on the behaviours most likely to close them.
This is also where gamification can help. Used well, leaderboards, fair competition, and incentives that pay for themselves can make lead KPIs more visible and motivating. Used badly, they become noise. The difference is whether the competition is tied to controllable actions and clear targets rather than random outcomes.
Weekly retail performance metrics that managers should review
Not every KPI needs daily attention. Strong retail operators review metrics by management cadence.
Daily store-level review
Daily review should focus on the few measures that affect execution immediately:
- Sales vs target
- Conversion
- ATV or UPT
- Stock availability on priority lines
- Promotional readiness
- Customer issues from the previous shift
This is the immediate operating view. It helps managers react quickly.
Weekly manager rhythm
Weekly retail performance metrics are where the real management conversation should happen. This is the cadence for spotting trends, not just firefighting.
A strong retail store scorecard should include:
- Sales vs target trend
- Conversion trend
- ATV and UPT trend
- Attachment rate trend
- Sales per labour hour
- Promotional execution consistency
- Customer feedback themes
- Coaching actions completed
- Stores or teams falling behind comparable peers
A useful retail store scorecard keeps performance visible without overwhelming the team. It should show target, actual, variance, and the one action required next.
Monthly leadership review
Monthly review is for broader pattern recognition across the network:
- Sales growth
- Margin
- Productivity
- Retention or turnover risk indicators
- Store-to-store performance differences
- Repeat execution issues
This is where regional and head office leaders can separate one-off fluctuations from structural gaps.
What to ignore in a retail KPI dashboard
If everything is important, nothing is.
The best retail performance dashboards are disciplined about what they exclude.
Vanity metrics
Training hours, dashboard logins, or generic engagement scores do not matter unless they connect to store outcomes. If a metric cannot explain performance or improve execution, it should not take up prime space.
Context-free rankings
Leaderboards can be powerful, but only when they are fair. Ranking stores with very different traffic, formats, or stock conditions against one another often creates frustration rather than motivation.
Fair competition works best when stores are compared against relevant peers, clear targets, or improvement over baseline.
Metrics with no owner
A KPI without an owner is just decoration. Every measure on a retail dashboard should sit with someone who can respond to it.
Metrics with no action path
A simple test helps here. If a KPI turns red today, can a manager take a sensible action this week?
If the answer is no, it probably does not belong at the centre of the dashboard.
What a good retail dashboard for store managers should look like
A practical retail dashboard for store managers should do three things well.
First, it should keep the number of headline KPIs tight. Managers do not need fifty measures. They need a short list that reflects commercial performance, operational readiness, and team execution.
Second, it should connect metrics to targets and actions. Visibility matters, but visibility without follow-through changes very little.
Third, it should make performance motivating, not just visible. When teams can see progress, compete fairly, get recognised, and understand how to win, KPIs become more than reporting. They become part of the operating system.
That is where many retailers now need more than a standard dashboard. They need a system that links KPI visibility to manager coaching, frontline engagement, micro-learning, nudges, rewards, and recognition.
See how Moonstar helps retailers turn store performance visibility into better execution on our sales performance page.
Final thought
The best retail KPIs are not the most impressive ones. They are the ones that help managers act.
A useful retail performance dashboard does not just tell a store manager that sales are down. It shows where execution is slipping, where the performance gaps are, and what action to take this week.
That is the difference between reporting and management.
And in retail, management is where performance moves.
FAQs
What is a retail performance dashboard?
A retail performance dashboard is a view of the store KPIs that matter most for sales, execution, productivity, and team performance. It helps managers see performance gaps quickly and decide what action to take next.
What are the most important retail KPIs for store managers?
The most important retail KPIs for store managers usually include sales vs target, conversion rate, average transaction value, units per transaction, attachment rate, sales per labour hour, stock availability, promotional execution, customer feedback trends, and coaching follow-through.
How many KPIs should a store manager track?
Most store managers should focus on a small number of high-value KPIs rather than dozens of measures. For most retail environments, 8 to 10 core KPIs are enough to give managers clear visibility without creating noise.
What should a retail store scorecard include?
A retail store scorecard should include the KPI name, target, actual result, variance, and the next action. It should help managers review performance in a consistent weekly rhythm and keep teams focused on the metrics that matter.
What is the difference between lead and lag KPIs in retail?
Lag KPIs measure results that have already happened, such as sales or conversion. Lead KPIs measure the behaviours and conditions that influence future results, such as recommendation behaviour, coaching activity, stock readiness, or training completion.
Why do some retail dashboards fail?
Retail dashboards often fail because they track too many metrics, rely too heavily on lagging outcomes, or show numbers without ownership or action. A useful dashboard helps managers understand what changed, why it changed, and what to do next.
How can gamification improve retail KPI performance?
Gamification can improve retail KPI performance by making clear targets, leaderboards, recognition, and fair competition part of the daily rhythm. When linked to controllable behaviours and relevant KPIs, gamification can increase execution, employee engagement, and sales performance.
Last updated on 12.03.2026